
At AGBT a couple of weeks ago, I presented a poster with an overview of methods developed by GRC members to sequence and assemble viral genomes from clinical samples. To view the poster, follow the link below:
Author Archives: admin
AGBT Whole Genome Capture Poster
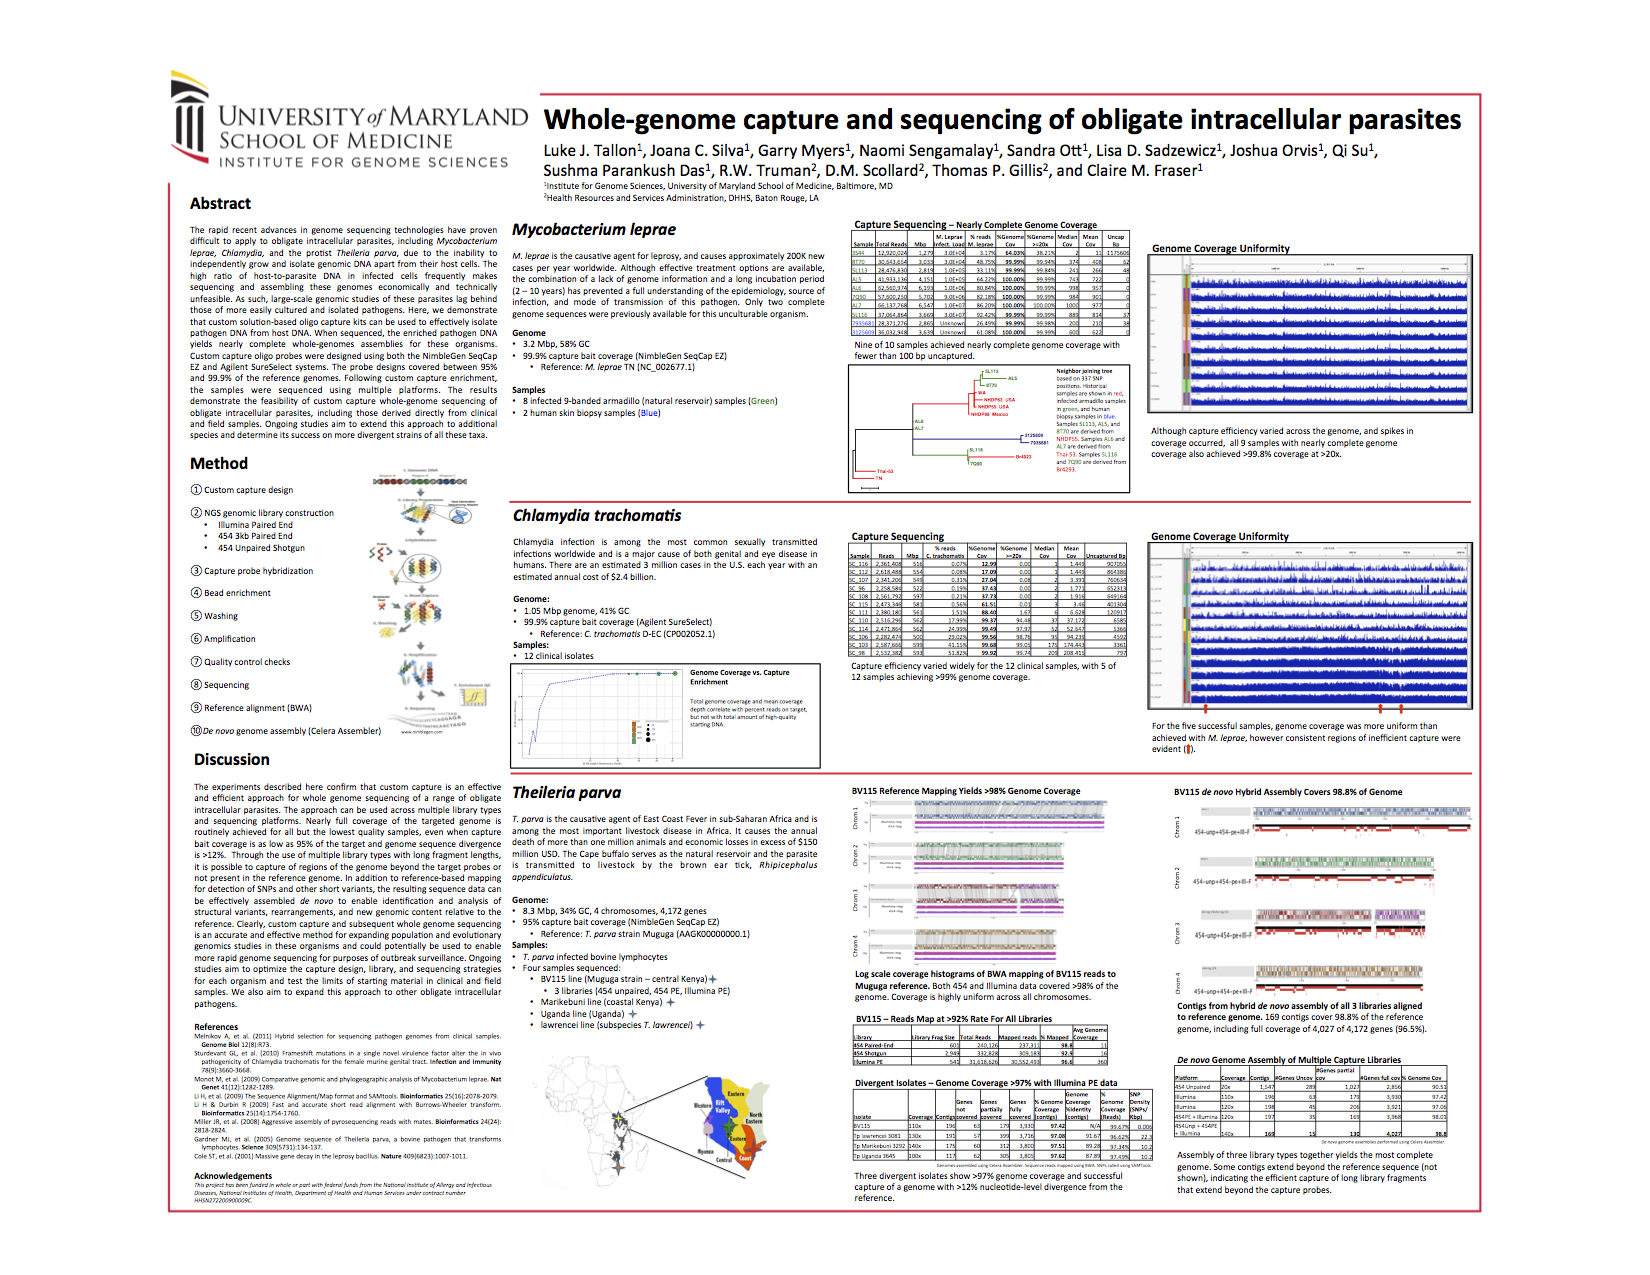
IGS also presented a poster about custom capture at this year’s AGBT meeting. The poster below presents data demonstrating that custom capture can be an effective way to sequence entire genomes of obligate intracellular parasites that cannot be grown independently, including such organisms isolated form field samples.
AGBT Assembler Comparisons Poster
One of the posters IGS presented at AGBT 2013 involved a thorough comparison of sequencing platforms and assemblies strategies across 5 microbial species that vary in both genome size and GC content. The conclusions from this study aim to inform future large-scale microbial projects and aid in efficiency and project design.
Please click on the link below to view a PDF image of the actual poster.
AGBT 2013 Assembly Comparison Poster
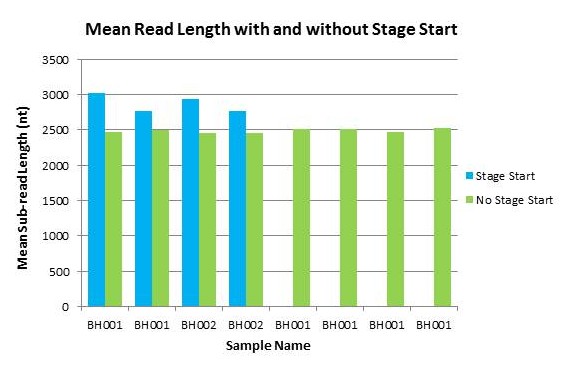
The PacBio ‘Stage Start’ Feature
A new feature that was added with the recent PacBio upgrade is something called ‘Stage Start’. This allows for data collection to start earlier than it did previously. When this option is used, data collection begins immediately after the polymerase is activated, resulting in longer reads.
Below are the results from a quick test we performed. We sequenced two libraries with and without the ‘Stage Start’ feature turned on.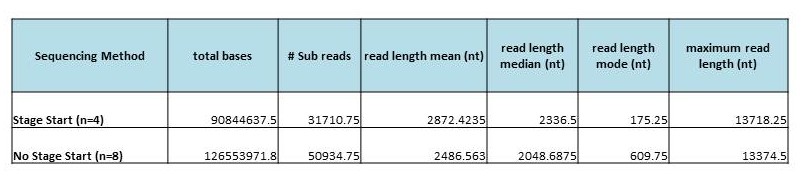
The libraries sequenced were about 8kb in length, and were sequenced using the Magbead Standard Seq v1 protocol. One 90-minute movie was taken of each SMRTcell. Standard Polymerase Binding and Sequencing kits were used (not the newer ‘XL’ version of the kits).
Assembler Comparisons
Over the past few months, several members of the GRC bioinformatics team have been working diligently on testing a variety of assemblers and analyzing results. The assembler testing is intended to help critically evaluate the results/performance of some of the more popular de novo assemblers. Similar studies have been done before (such as: http://gage.cbcb.umd.edu/), but we aim to expand upon those studies by testing on different organisms and data types. To that end, WGS data generated at IGS, from many samples and across multiple species (such as E. coli, V. cholera, S. aureus and M. massiliense), have been assembled at multiple coverage levels using assemblers such as Celera Assembler, MSRCA, Velvet, SOAPdenovo and ABySS. In addition, the data has been sequenced using various NGS platforms, including Illumina HiSeq, Illumina MiSeq and PacBio. These data types will be assembled in different combinations and as stand-alone assemblies to gauge the affects of hybrid assemblies of different data types and combinations. We hope to have lots of stats compiled in the very near future.
PacBio Upgrade
The PacBio was recently upgraded to version 1.3.3. With this upgrade comes the ability to use the XL versions of the DNA/Polymerase Binding and DNA Sequencing kits. These new kits should result in a longer average readlength (5000 bp) in comparison to the ~3000 bp average we get with the current C2 chemistry.
Using both new kits together does come at a cost. The data produced with the DNA Sequencing Kit XL 1.0 will be of a lower quality than with C2, and is recommended only when the data will be error corrected with shorter, more accurate reads.
For a boost in average read length without sacrificing quality of the reads, the DNA/Polymerase Binding Kit XL 1.0 can be used with the C2 sequencing chemistry rather than with the newer XL sequencing kit.
More details to follow…
MiSeq: More reads and longer read lengths are now available
Over the past couple of months we have been evaluating the MiSeq upgrade. This upgrade includes the ability to sequence longer reads (250nt from each end, so 500 nt per library fragment) and to collect data from more clusters (both the top and bottom of each channel are imaged). We just had a 250 PE run that exceeded 30 million reads – that is just over 8 Gbases of data! This is a nice jump up from the ~13M reads (~2 Gbases) per run we were getting before.
Disclaimer: We are still in data-gathering mode to determine what the average expectation should be for each run- it would be nice to get 30 million reads from every run, but that may not happen.
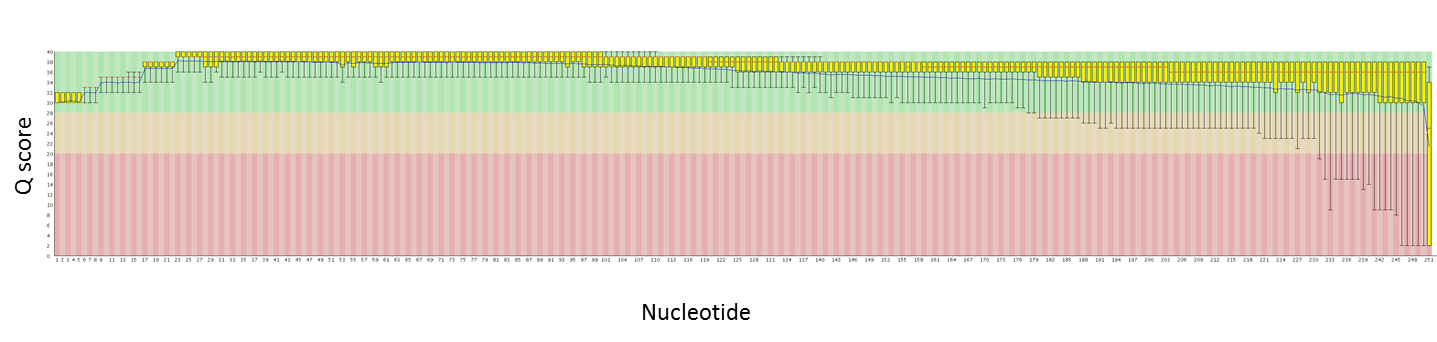
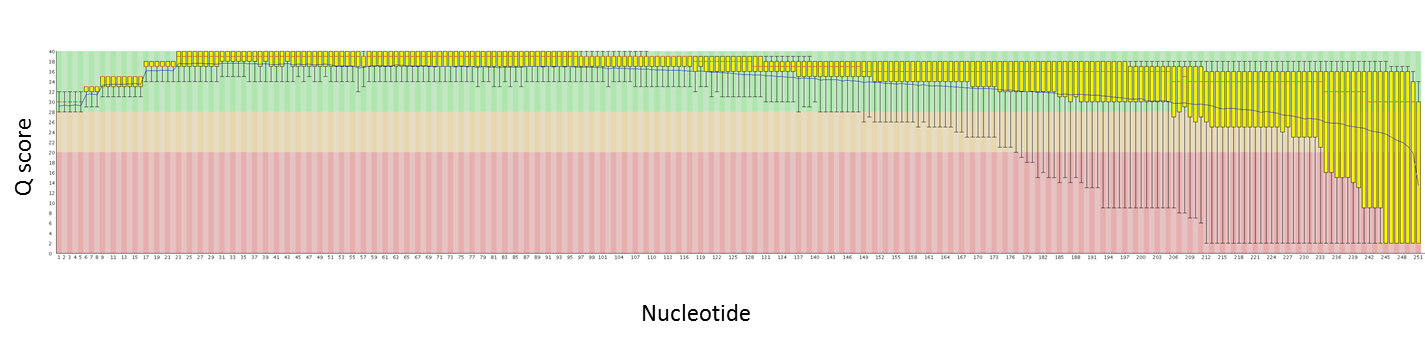
Here are quality plots of a 250 PE run with genomic PE libraries. We are working to maximize quality as the read lengths increase.
Read 1:
Read 2:
We can now combine the benefits of Illumina’s high read counts with the benefits of longer reads.
Up next is to see how MiSeq/Pac Bio hybrid assemblies measure up to HiSeq/454 hybrid assemblies, and a comparison of assemblies using HiSeq 100bp PE reads vs MiSeq 250 bp PE reads.