This beta version of LGTView aggregates the results from the LGTSeek pipelines with metadata. An example of the LGTView interface is shown in the figure below. There are links to TwinBLAST while the metadata are summarized in the pie charts. The pie charts are interactive such that clicking on a slice of the pie will limit the data.
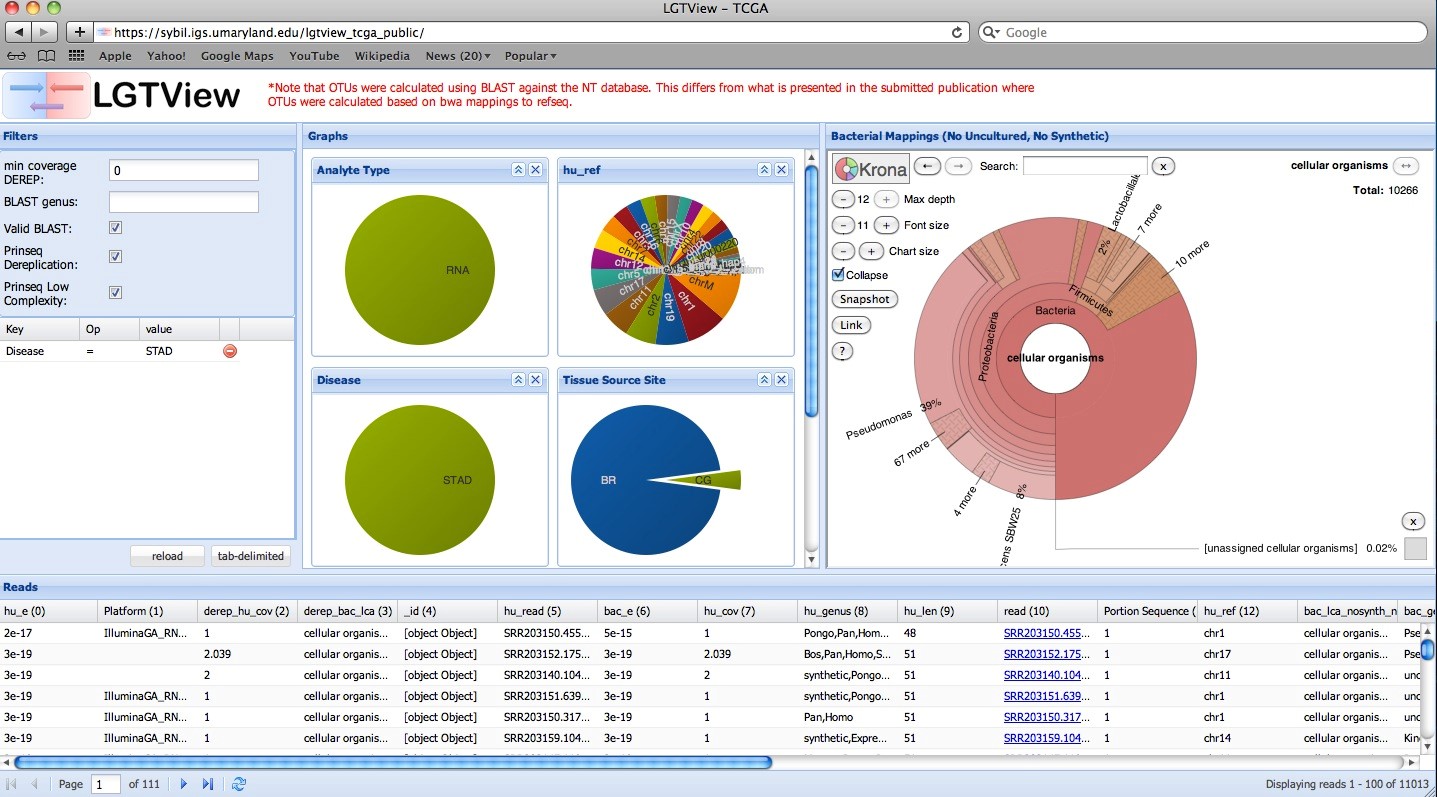
Figure 1. LGTView Interface.
A beta version of the LGTView VM can be found here.
A tutorial for the beta version of LGTView can be found here.
The code for LGTView is available on GitHub.
Example 1: 1000 Genomes
http://lgt.igs.umaryland.edu/1000genomes/
Example 2: TCGA
http://lgt.igs.umaryland.edu/tcga/
Example 3: Arthropod
http://lgtview.igs.umaryland.edu/lgtview_arthropod_v2/